Dashboard
Analytics dashboard you build your way.
All of your client's Google Analytics 4 data in one dashboard. You choose which metrics to show, drag the widgets and configure the layout in a few clicks. Each client can have their own view.
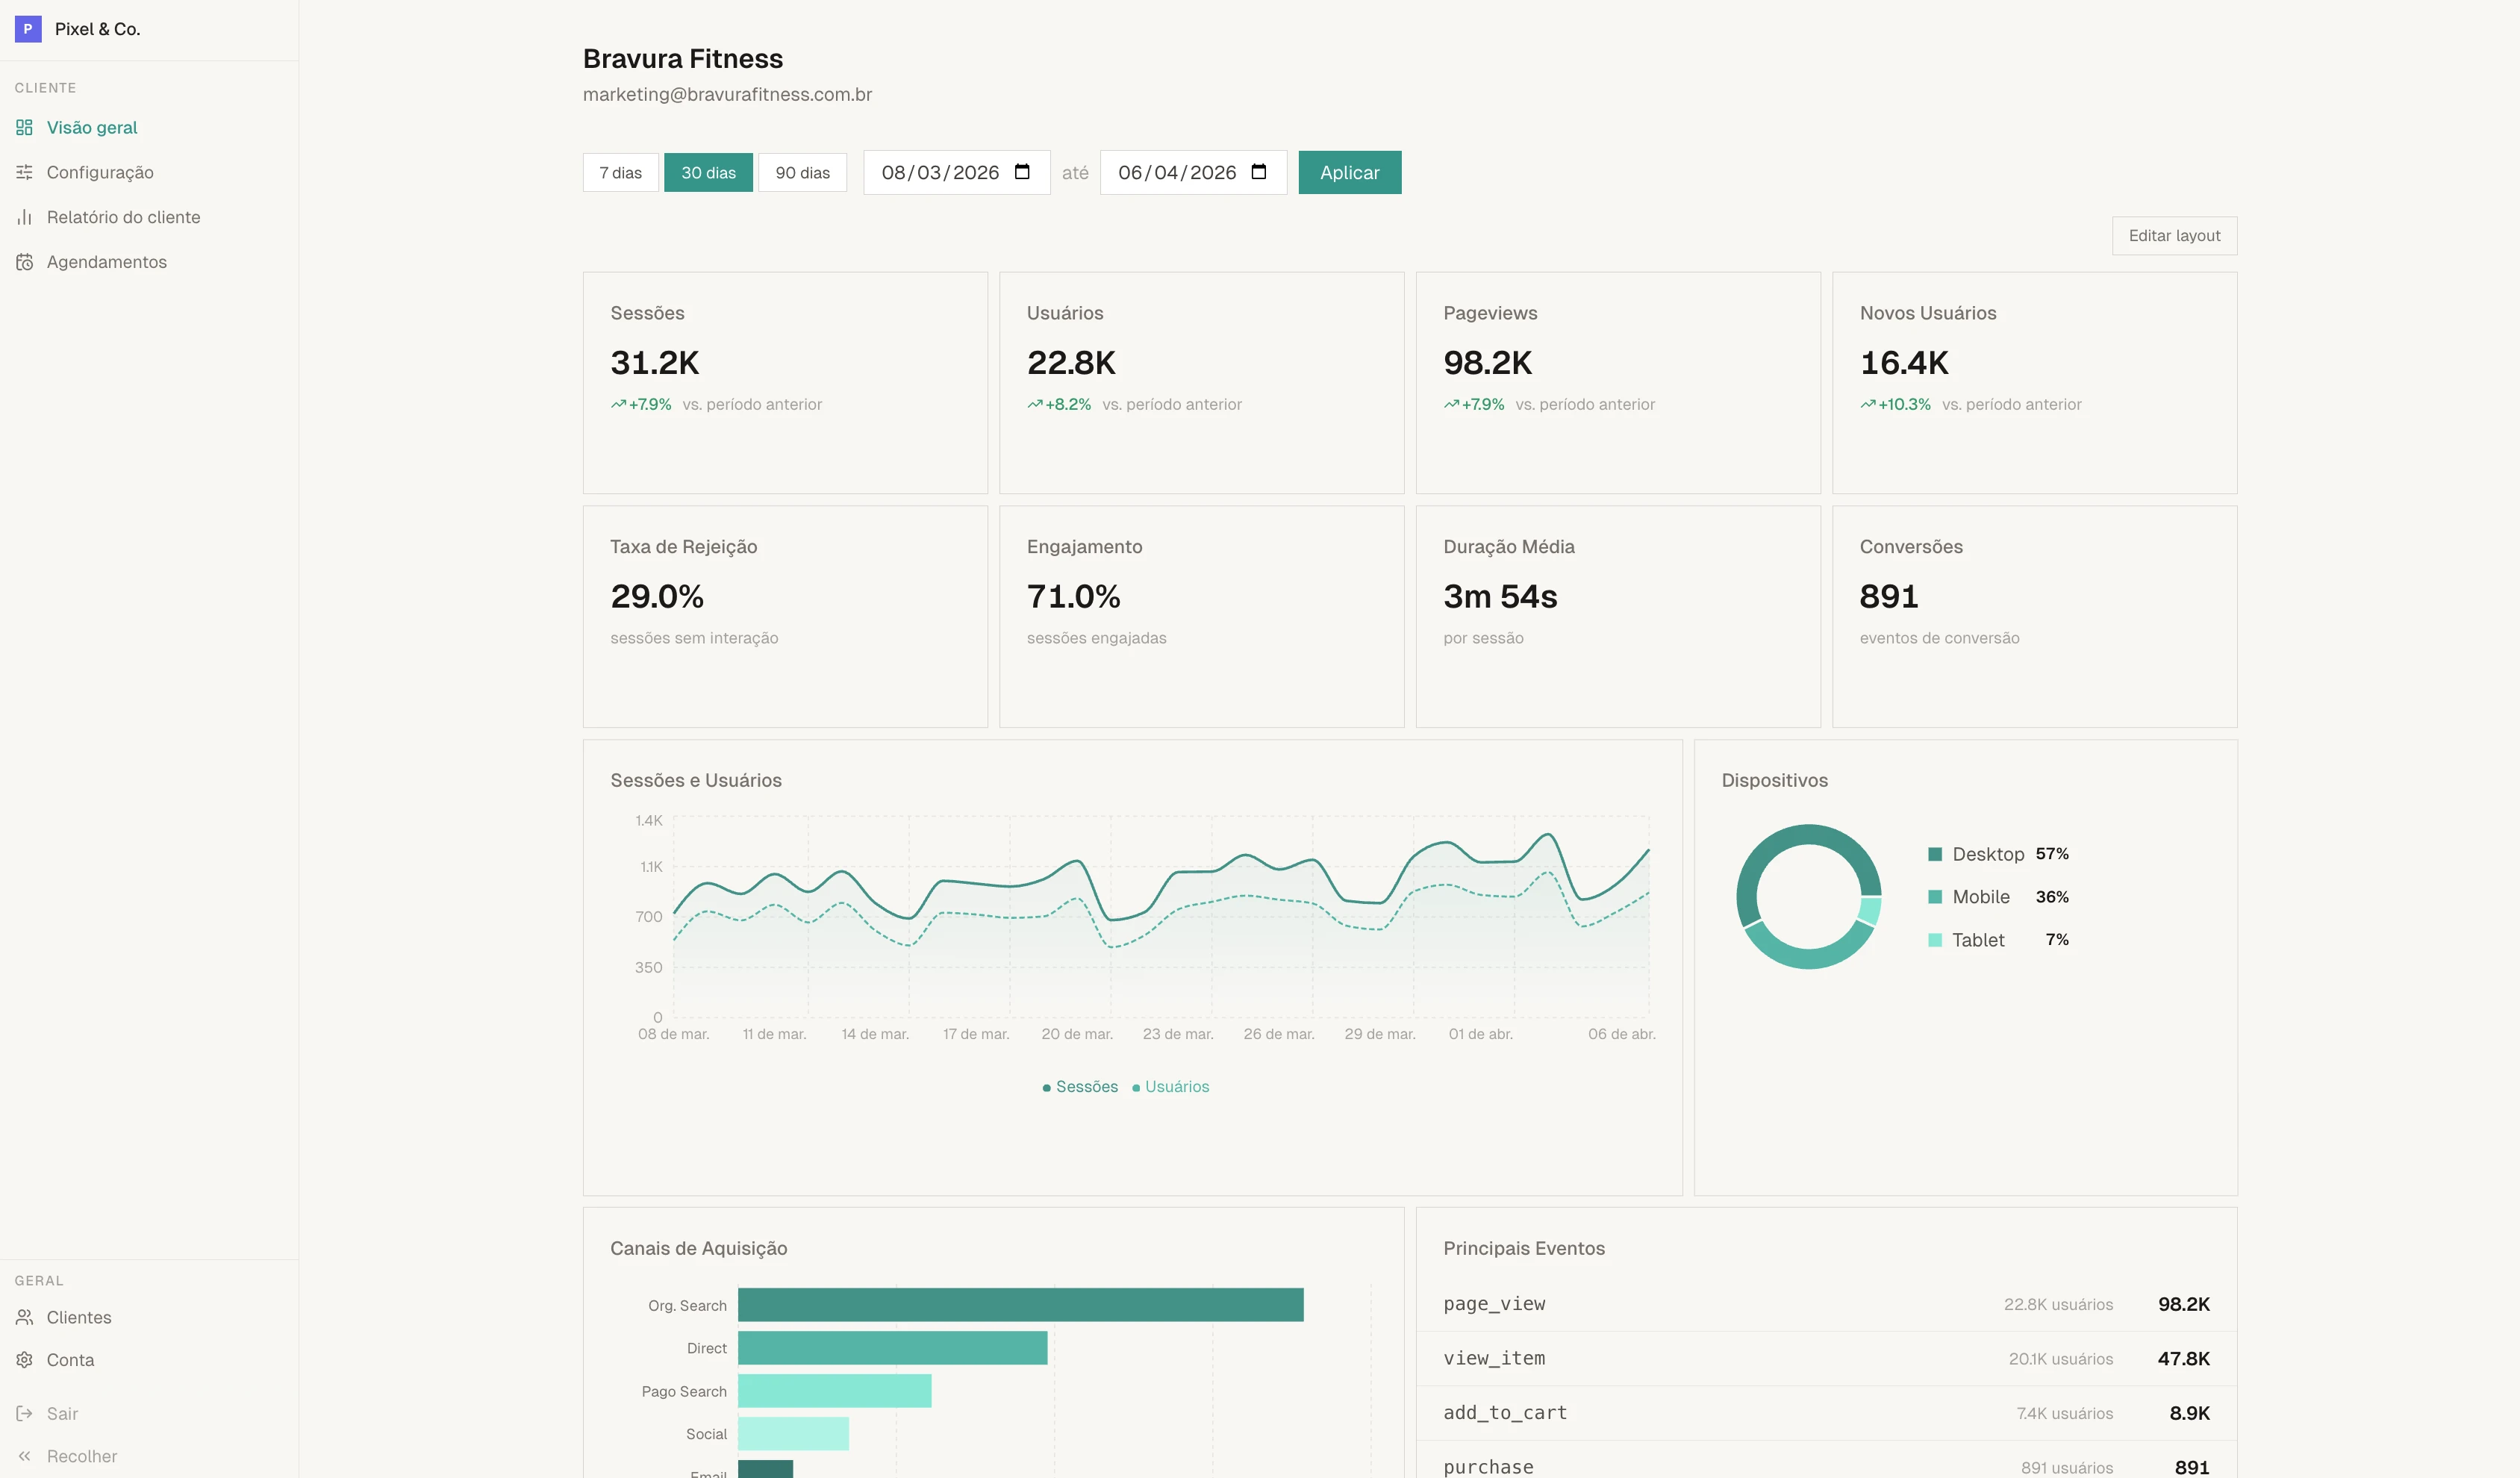
8 KPIs
The metrics your agency needs, all with period comparison.
Each KPI shows the current value and an arrow indicating whether it went up or down compared to the previous period. Large numbers are automatically formatted (1.2K, 3.5M). Duration appears as minutes and seconds.
Sessions
Total visits in the selected period, compared to the previous period
Users
Unique visitors who accessed the client's website
Pageviews
Total number of pages viewed
Conversions
Conversion events configured in the client's GA4
Engagement rate
Percentage of sessions with active interaction
Avg. duration
Average time each visitor spends on the site
New users
Visitors accessing the site for the first time
Bounce rate
Sessions that end without any interaction
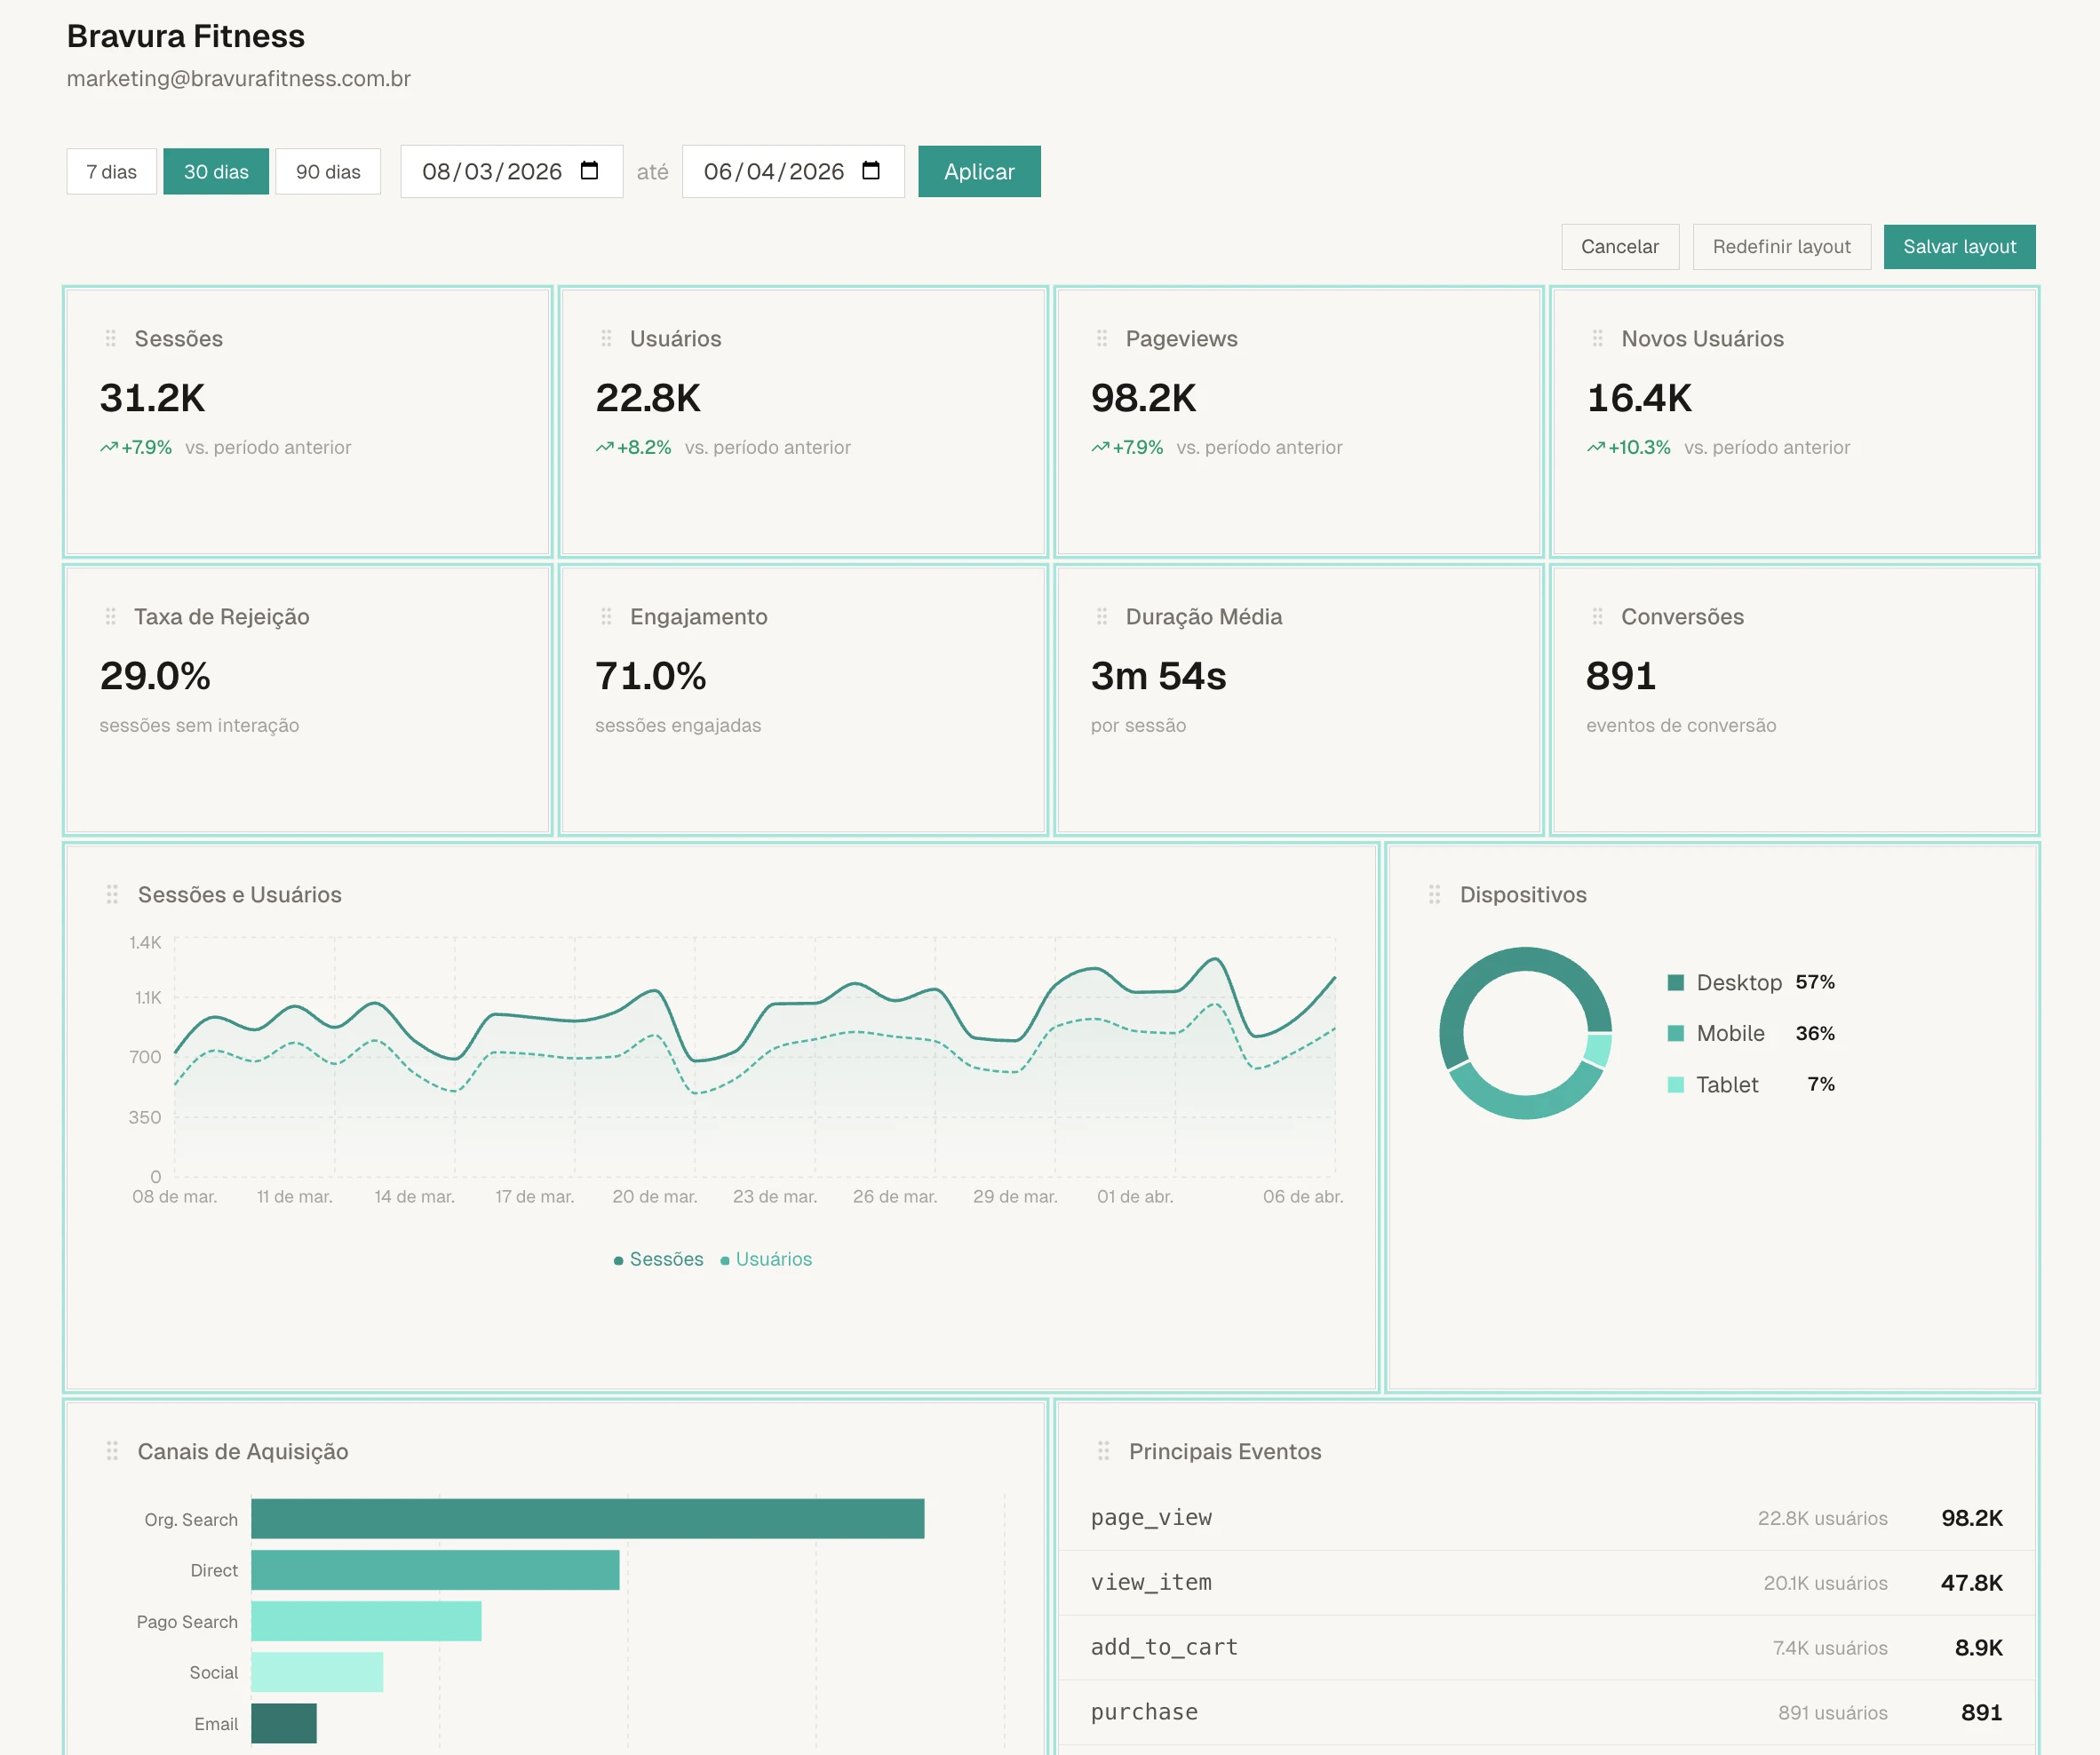
Visual editor
Drag, resize and save.
The dashboard uses a 12-column grid with drag-and-drop. Click "Edit layout", drag widgets to the position you want and adjust the size of each one. When done, save. The layout is saved per client, so each one can have a different organization.
If you want to go back to the default, there's a button to reset the original layout with one click.
6 views
Charts and tables that tell the data story.
Daily trend
Area chart showing sessions and users per day. Useful for identifying traffic patterns and access peaks.
Acquisition channels
Horizontal bar chart with traffic origin: organic, direct, social, paid and others. Shows where the client's visitors come from.
Top pages
Table with URL, title, pageviews, users, average time and bounce rate for each page.
Devices
Pie chart showing the split between desktop, mobile and tablet. Helps understand how the client's audience accesses the site.
Location
Ranking of countries with most sessions. Each country appears with a visual volume indicator.
Events
The 10 most triggered events in the client's GA4, sorted by count.
Period
Filter by 7, 30 or 90 days. Or choose any period you want.
Quick period buttons cover the most common scenarios. But if you need a specific range, the date picker lets you choose a start and end day. All KPIs and charts update immediately.
No more building dashboards by hand.
The first 50 lock in the launch price.